


Provides an overview of the entire sales pipeline, tracking deals across all stages, analyzing conversion rates, and monitoring the average duration per stage. It helps teams visualize pipeline health, identify bottlenecks, and optimize the sales process.
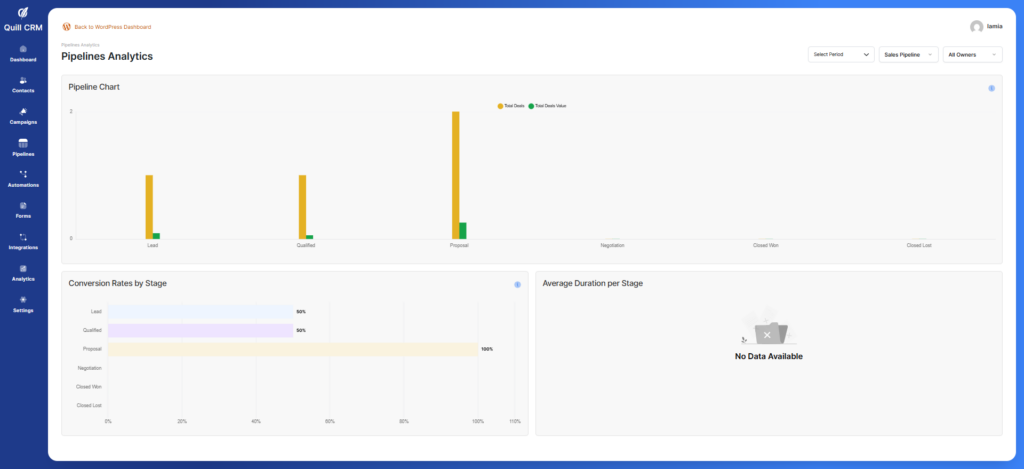
This section is divided into multiple subsections, each highlighting a different aspect of the pipeline:
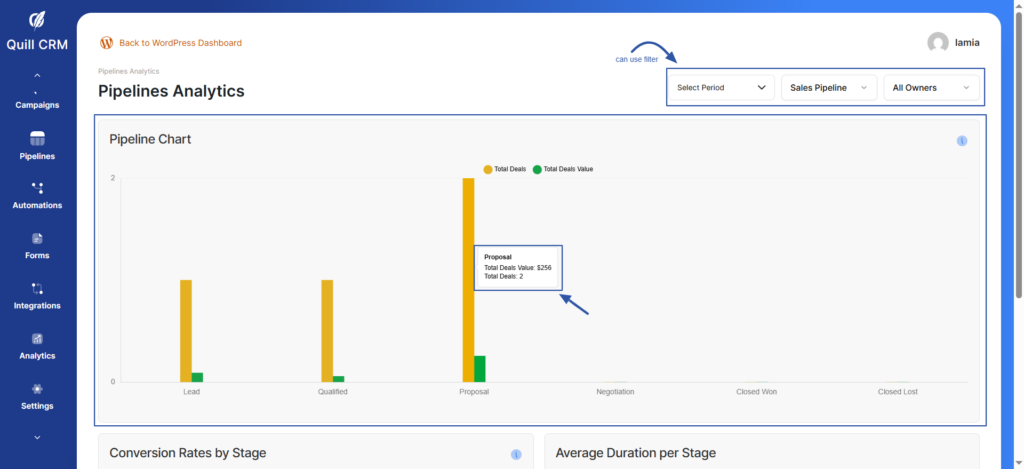
Pipeline Chart
Provides a comprehensive view of the pipeline, displaying each stage along with the deals contained within it and their total value. It helps track deal progression, identify bottlenecks, and assess overall pipeline health.
Conversion Rates by Stage
Displays the percentage of deals that move from one stage to the next, helping identify which stages convert well and which may need improvement
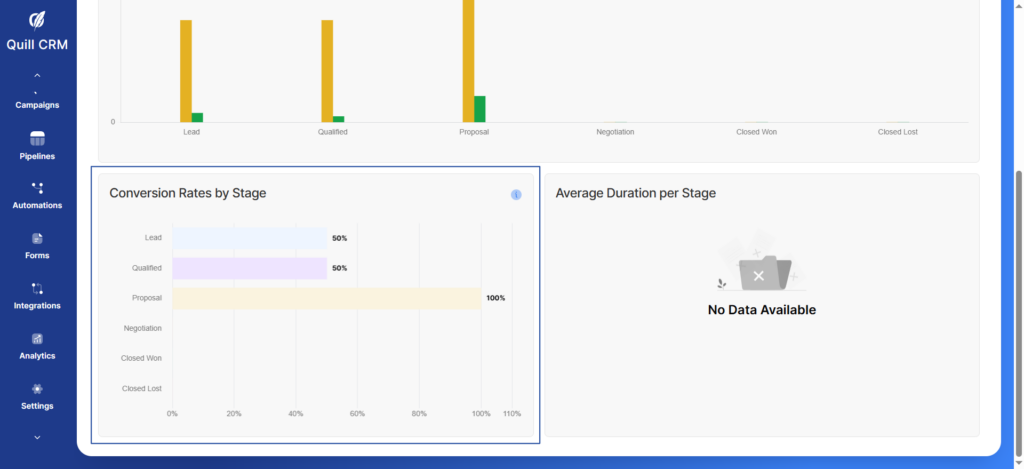
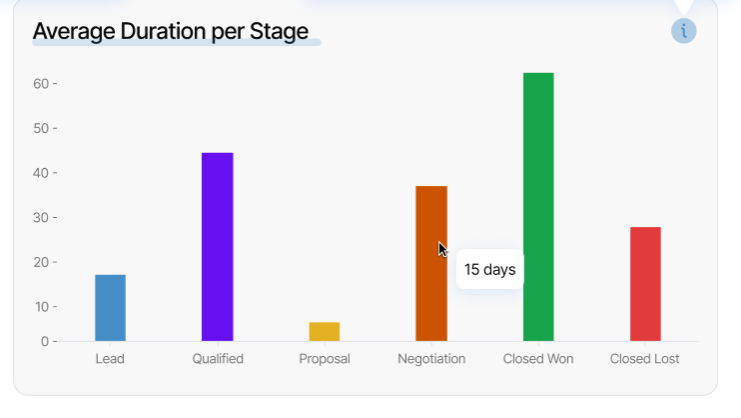
Average Duration per Stage
Shows the average time deals spend in each stage before progressing to the next stage, helping spot delays or stages that slow down the sales process.